Blog Analytics
Company
Wix
Role
Product Designer working with PM, BA, developers, and UX writer
Industry
SaaS
Date
December 2022 - March 2023
As one of Wix’s largest and most active products, the Blog platform sees significant user engagement, with 784K blog website admins visiting Wix Business Manager in October 2022.
To bridge this gap, our product team—including a PM, BA, developers, a UX writer, and myself as a Product Designer—collaborated to create a blog analytics app that simplifies performance tracking, delivering actionable, real-time insights to help users refine their content strategy with confidence.
Wix Blog is a powerful tool for content creators, but for bloggers to succeed, they need clear insights into their performance. While Wix provides analytics, users struggle to track and analyze their blog’s success efficiently.
Two major pain points emerged:
Disjointed data experience – Blog-related insights are spread across multiple reports, forcing users to switch between different sections to piece together meaningful data.
No in-context analytics – Users manage their blog and business from dedicated blog pages, yet key performance metrics are missing where they need them the most.
As a result, many users turn to third-party analytics tools, even paying for external solutions, which creates friction and drives them away from Wix’s ecosystem. This not only impacts the user experience but also represents a missed business opportunity for Wix to deliver more value and retain its blogging community.
Research revealed key usability issues and gaps in Wix Blog’s analytics experience:
Low discoverability of blog reports – In October 2022, 442K users visited the Blog Overview page, yet only 4% found and clicked on the hidden "All Blog Reports" button. This indicates that critical analytics are not easily accessible.
Navigation issues within analytics – 12K users (73%) who clicked "See Analytics" from the Post Overview page never reached their intended destination, highlighting a broken or confusing user flow.
Active blogs lack performance insights –119K blogs (15%) had 50+ post views, yet many users struggled to track their performance effectively due to fragmented reporting.
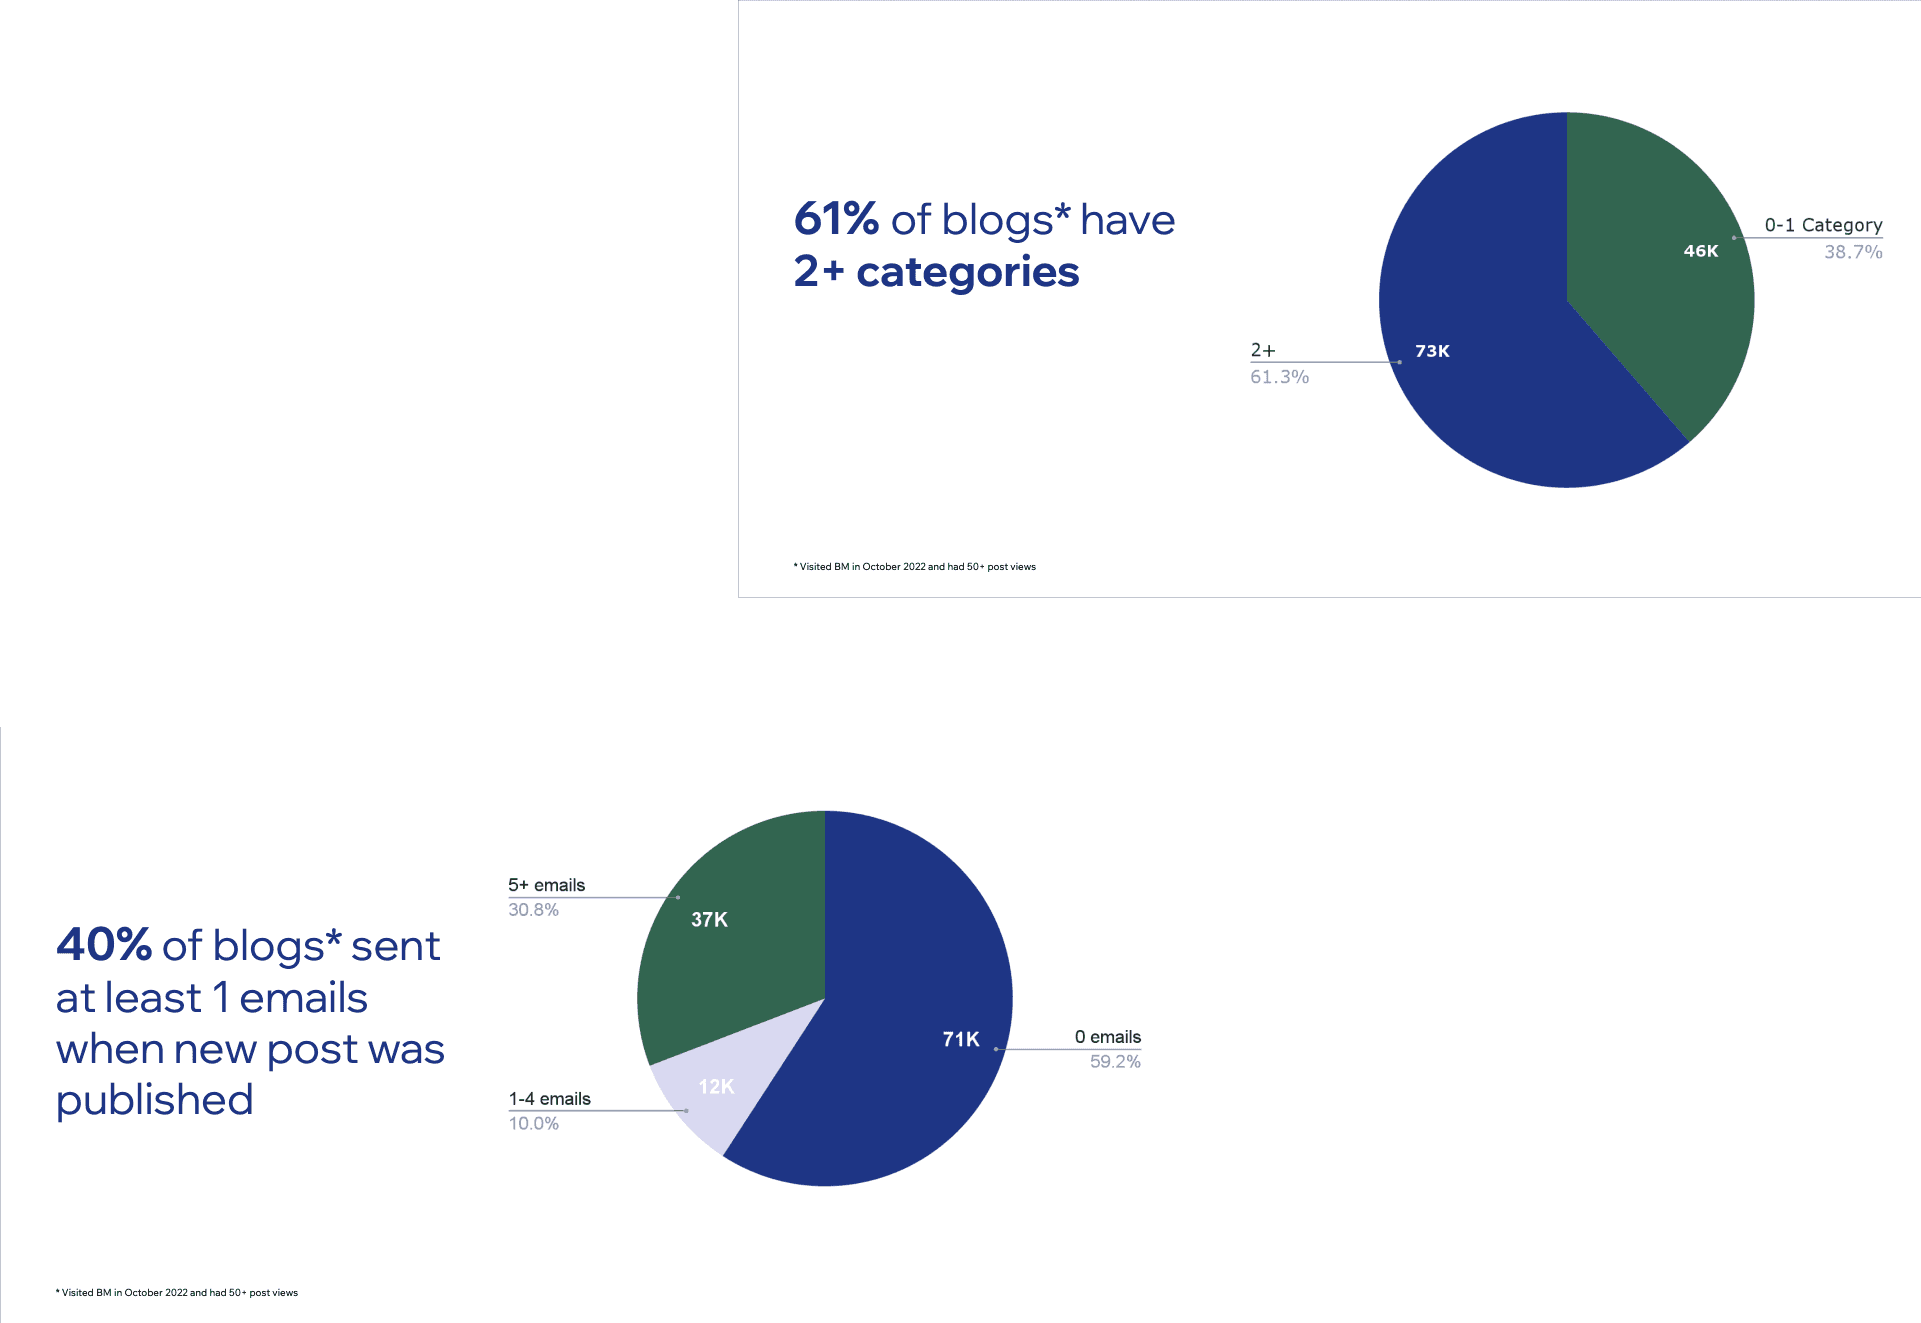
Missing data dimensions – Many bloggers actively use categories and tags to organize their content, but these attributes are not included in Wix’s analytics model, limiting their ability to analyze performance based on content structure.
To establish a strong foundation for the project, we conducted competitive research to understand industry standards and identify opportunities where Wix could differentiate itself. In parallel, we analyzed user feedback to ensure our solution addressed real pain points.
We examined analytics experiences from leading blog platforms and tools, including:
JetPack, Momently, Blogger, and Medium – to understand how built-in blog analytics are structured.
Google Analytics – to analyze how advanced users track content performance.
Additionally, to validate our direction, we analyzed user requests from interviews, support tickets, app reviews, and emails to identify recurring challenges and unmet needs.
By combining competitive insights with direct user feedback, we identified best practices, gaps in competitors’ solutions, and opportunities for Wix to provide a superior analytics experience.

Building on our research and user feedback, I defined key hypotheses to guide our design decisions:
1. Adding contextual analytics on blog pages will increase engagement.
Users currently struggle to find analytics reports (only 4% clicked the hidden "All Blog Reports" button).
By placing performance insights directly on the blog management page, users will engage with analytics more frequently.
2. Personalized recommendations will help bloggers make better decisions.
Users need actionable insights instead of raw data.
By introducing smart suggestions (e.g., "Your posts perform best on Tuesdays – consider posting at 10 AM"), bloggers can optimize their strategy easily.
Fixing navigation issues will reduce drop-offs.
73% of users who clicked “See Analytics” never reached their intended destination.
By streamlining navigation and surfacing key metrics upfront, users will be able to access data more efficiently.
Highlighting the best time to post will increase engagement.
Users tried to manually figure out the best time to post based on past performance.
A dedicated feature that analyzes post timing trends can provide clear, data-driven insights to help users maximize engagement.
After multiple iterations and user feedback, I finalized the Blog Analytics Widget and Dedicated Analytics Dashboard, ensuring a balance between usability, visibility, and business goals.
For the handoff process, we prepared:
High-fidelity designs aligned with the Wix design system.
Prototyped interactions to demonstrate key user flows.
Detailed design documentation outlining functionality, data visualization, and responsiveness.
Collaborative sessions with developers to ensure smooth implementation and address technical constraints..


